








What Is Website Performance Optimization?
Website performance optimization is the practice of making web pages load faster, respond quicker to user interactions, and render more smoothly. In 2026, performance is not merely a technical concern — it is a critical business metric that directly impacts conversion rates, search engine rankings, user satisfaction, and revenue.
Research from Google's Web.dev demonstrates that a one-second delay in page load time can reduce conversions by up to 7%. For e-commerce sites processing millions in revenue, this translates to hundreds of thousands of dollars in lost sales annually.
The modern performance landscape is shaped by Google's Core Web Vitals framework, which establishes measurable thresholds for loading speed, interactivity, and visual stability. Sites that meet these benchmarks gain a ranking advantage in search results and deliver superior user experiences across all devices.
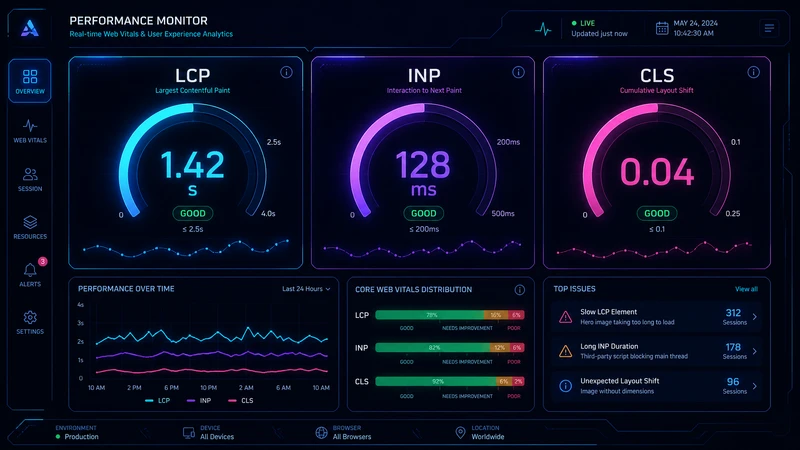
Core Web Vitals: The Foundation of Modern Performance
Largest Contentful Paint (LCP)
LCP measures the time it takes for the largest visible content element to render within the viewport. Google considers an LCP of 2.5 seconds or less as "Good." The largest content element is typically a hero image, a large text block, or a video poster frame.
Common causes of poor LCP include slow server response times (high TTFB), render-blocking JavaScript and CSS, slow resource load times, and client-side rendering bottlenecks. Research from HTTP Archive reveals that the median LCP on mobile is still above 3.5 seconds for most websites, indicating significant room for improvement.
Strategies to improve LCP include implementing server-side rendering (SSR) or static site generation (SSG), preloading critical resources with <link rel="preload">, using a CDN to reduce geographic latency, optimizing images with modern formats like WebP and AVIF, and minimizing render-blocking resources through critical CSS inlining and deferred script loading.
Interaction to Next Paint (INP)
INP replaced First Input Delay (FID) in March 2024 as the responsiveness metric in Core Web Vitals. Unlike FID, which only measured the delay of the first interaction, INP captures the latency of all interactions throughout the page lifecycle, reporting the worst-case scenario (at the 98th percentile).
A good INP score is 200 milliseconds or less. Poor INP is typically caused by long-running JavaScript tasks that block the main thread, excessive DOM size, synchronous layout recalculations (layout thrashing), and heavy event handlers that perform complex computations during user interactions.
Improving INP requires breaking long tasks into smaller chunks using requestIdleCallback() or the Scheduler API, reducing main-thread work through web workers, virtualizing large lists and tables, debouncing expensive event handlers, and implementing progressive hydration strategies in JavaScript frameworks.
Cumulative Layout Shift (CLS)
CLS measures the visual stability of a page by quantifying unexpected layout shifts. A good CLS score is 0.1 or less. Layout shifts occur when visible elements change position without user interaction — for example, when an ad loads above content and pushes text downward, or when a web font swaps and changes text dimensions.
Preventing CLS requires setting explicit dimensions on images and videos, reserving space for dynamic content like advertisements, using CSS contain and content-visibility properties, avoiding inserting content above existing content (except in response to user interaction), and implementing font loading strategies with font-display: optional or font-display: swap combined with font preloading.

Server-Side Performance Strategies
Server Response Time (TTFB)
Time to First Byte (TTFB) measures how long the browser waits for the first byte of a response from the server. While not a Core Web Vital itself, TTFB directly impacts LCP and overall page load performance. A TTFB under 200ms is considered excellent.
Optimizing TTFB involves efficient database query optimization with proper indexing, server-side caching layers (Redis, Memcached), edge computing with CDN providers like Cloudflare or Fastly, HTTP/3 and QUIC protocol adoption, and application-level optimizations including connection pooling, efficient middleware pipelines, and compiled template engines.
CDN and Edge Computing
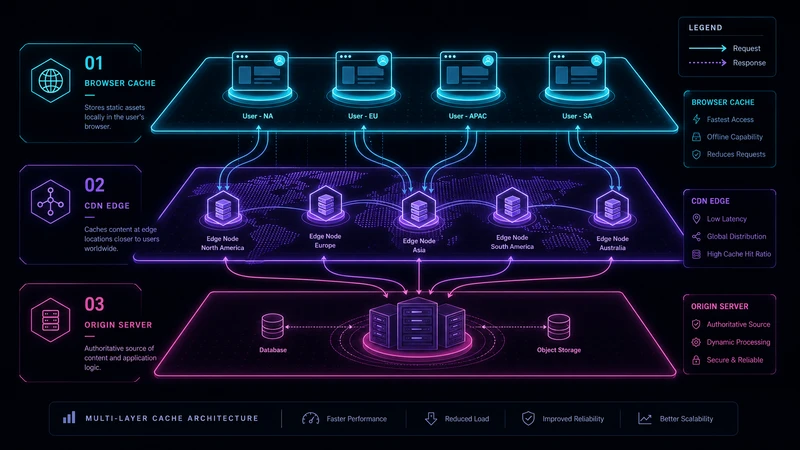
Content Delivery Networks distribute website assets across geographically distributed edge servers, dramatically reducing latency for users worldwide. Modern CDNs go far beyond static asset caching — they now offer edge computing capabilities, image optimization, DDoS protection, and serverless function execution at the edge.
Edge computing platforms like Cloudflare Workers, AWS CloudFront Functions, and Vercel Edge Functions enable server-side logic execution within milliseconds of the user, eliminating the round-trip to origin servers for dynamic content. Research from Akamai shows that CDN-optimized sites load 50-70% faster on average than those served from a single origin.
Caching Strategies
A multi-layered caching strategy is essential for high-performance websites. This includes browser caching with appropriate Cache-Control headers, service worker caching for offline-first experiences, application-level caching with in-memory stores, and CDN edge caching with intelligent purging strategies. The key is setting appropriate TTLs (time-to-live) values that balance freshness with performance — static assets like images and fonts can be cached indefinitely with content-hash-based URLs, while dynamic content requires shorter TTLs or cache invalidation mechanisms.
Front-End Performance Optimization
JavaScript Optimization
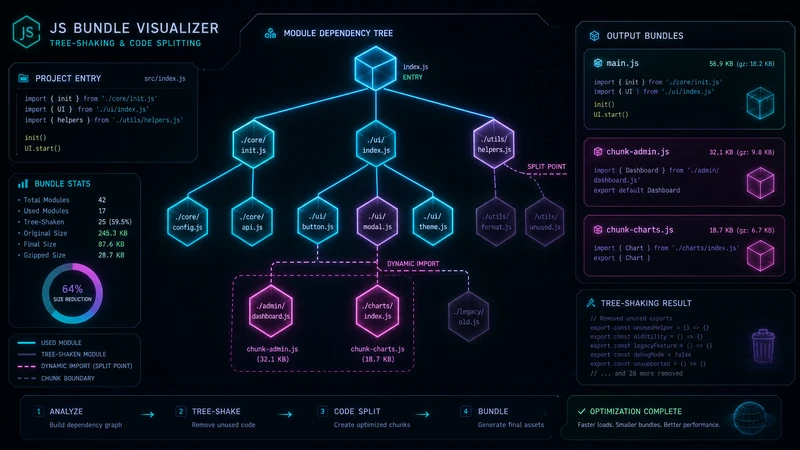
JavaScript is often the largest contributor to poor performance on modern websites. Key optimization strategies include code splitting and lazy loading to reduce initial bundle sizes, tree shaking to eliminate dead code, minification and compression (Brotli provides 15-25% better compression than gzip), and deferring non-critical scripts with async or defer attributes.
Modern bundlers like Vite, esbuild, and Turbopack offer significantly faster build times compared to traditional tools. Module federation enables sharing code across micro-frontends without duplication. For JavaScript-heavy applications, partial hydration strategies (islands architecture) can dramatically reduce the amount of client-side JavaScript that needs to execute.
Image Optimization
Images typically account for 50-75% of a web page's total weight. Optimization strategies include serving images in next-gen formats (WebP provides 25-30% smaller files than JPEG, AVIF offers 50% savings), implementing responsive images with srcset and sizes attributes, lazy loading below-the-fold images with loading="lazy", and using image CDNs for automatic format negotiation, resizing, and quality optimization.
The <picture> element enables format fallback chains, ensuring browsers receive the most efficient format they support. Art direction with the <picture> element allows serving different image crops for different viewport sizes, optimizing both visual impact and file size across devices.
CSS Optimization
CSS optimization focuses on reducing render-blocking impact and minimizing file sizes. Critical CSS inlining — extracting and inlining the CSS needed for above-the-fold content — eliminates render-blocking stylesheet requests. CSS containment with the contain property limits the browser's rendering scope, improving paint performance. The content-visibility: auto property enables browsers to skip rendering off-screen content entirely, dramatically improving initial render times for long pages.
Performance Monitoring and Testing
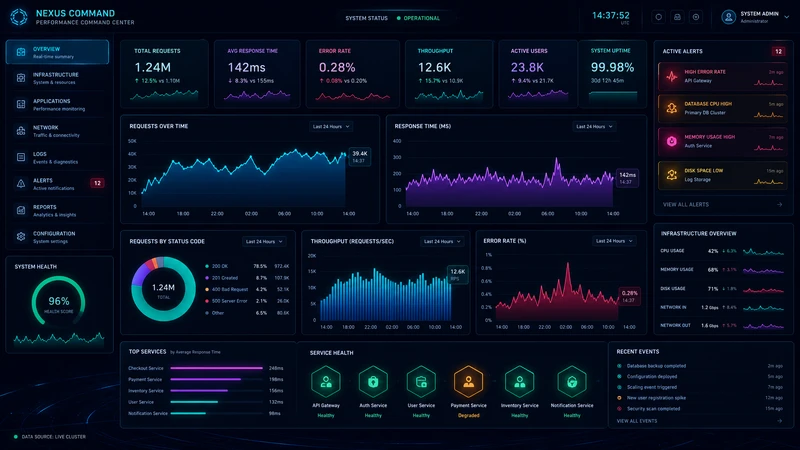
Continuous performance monitoring is essential for maintaining optimal speeds. Lab testing tools like Lighthouse, WebPageTest, and Chrome DevTools provide detailed performance audits in controlled environments. Field data from the Chrome User Experience Report (CrUX) reflects real-world performance across actual user visits.
Performance budgets establish maximum thresholds for key metrics and resource sizes, ensuring new features don't degrade performance. Automated performance testing in CI/CD pipelines catches regressions before they reach production. Real User Monitoring (RUM) platforms provide continuous visibility into performance across different devices, networks, and geographic locations, enabling data-driven optimization decisions.
Advanced Performance Techniques for 2026
Emerging performance techniques include speculative loading with the Speculation Rules API, which enables browsers to prefetch or prerender pages that users are likely to navigate to. View Transitions API creates smooth, app-like transitions between pages without JavaScript framework overhead. Priority Hints (fetchpriority attribute) give browsers explicit guidance on resource loading order, ensuring critical assets are fetched first.
WebAssembly (Wasm) enables near-native performance for computationally intensive tasks like image processing, video encoding, and complex calculations. Shared Element Transitions, currently being standardized, will enable seamless element animations between page navigations, further blurring the line between web and native application performance.
The Business Impact of Performance
Performance optimization delivers measurable business results. Research from McKinsey Digital and Google shows that every 100ms improvement in page load time increases conversion rates by up to 8% for retail sites. Pinterest reduced perceived wait times by 40% and increased search engine traffic by 15%. Vodafone improved LCP by 31% and saw a 8% increase in sales.
For SEO, Google explicitly uses Core Web Vitals as ranking signals. Sites that meet all three CWV thresholds gain a measurable advantage in search rankings, particularly in competitive queries where multiple results have similar content quality and relevance signals. In the age of AI search, fast-loading pages are also more efficiently crawled and indexed by both traditional search engines and AI training pipelines.