Gasoline Prices & Antitrust — A DOJ/FTC Enforcement Framework
Answering the July 2026 Federal Inquiry into Gasoline Prices — Why the Pump Price Rises, What the Law Actually Prohibits, and How Targeted Enforcement Protects Consumers While Saving Taxpayers Money
Keywords: gasoline prices, antitrust enforcement, DOJ Antitrust Division, Federal Trade Commission, Sherman Act, Clayton Act, FTC Act Section 5, price gouging, crude oil, refining margins, rockets and feathers, algorithmic pricing, EIA, AAA, consumer protection, taxpayer savings
Executive Summary
In July 2026, the U.S. Department of Justice (DOJ) and the Federal Trade Commission (FTC) signaled renewed attention to gasoline prices and the possibility of anticompetitive conduct in fuel markets. This white paper answers that inquiry directly. Its thesis is precise: high gasoline prices are, in the overwhelming majority of cases, the product of verifiable market fundamentals — the cost of crude, refining margins, logistics, seasonality, and taxes — and not of widespread collusion. Federal law, it bears repeating, does not prohibit high prices; it prohibits collusion and monopolization.
The practical consequence is liberating for public policy. Rather than pursuing broad price controls — which the economic evidence repeatedly ties to shortages, lines, and black markets — or speculative litigation that rarely survives judicial scrutiny, federal resources yield far more when directed at concrete, verifiable red flags of unlawful conduct. This paper decomposes the pump price, explains the puzzle of falling crude alongside a rising retail price, precisely maps the available legal arsenal — the Sherman, Clayton, and FTC Acts — and proposes an evidence-based enforcement framework that protects consumers while saving taxpayers money.
“The purpose of antitrust enforcement is not to punish high prices, but to preserve competition. Where competition is vigorous, prices take care of themselves.”
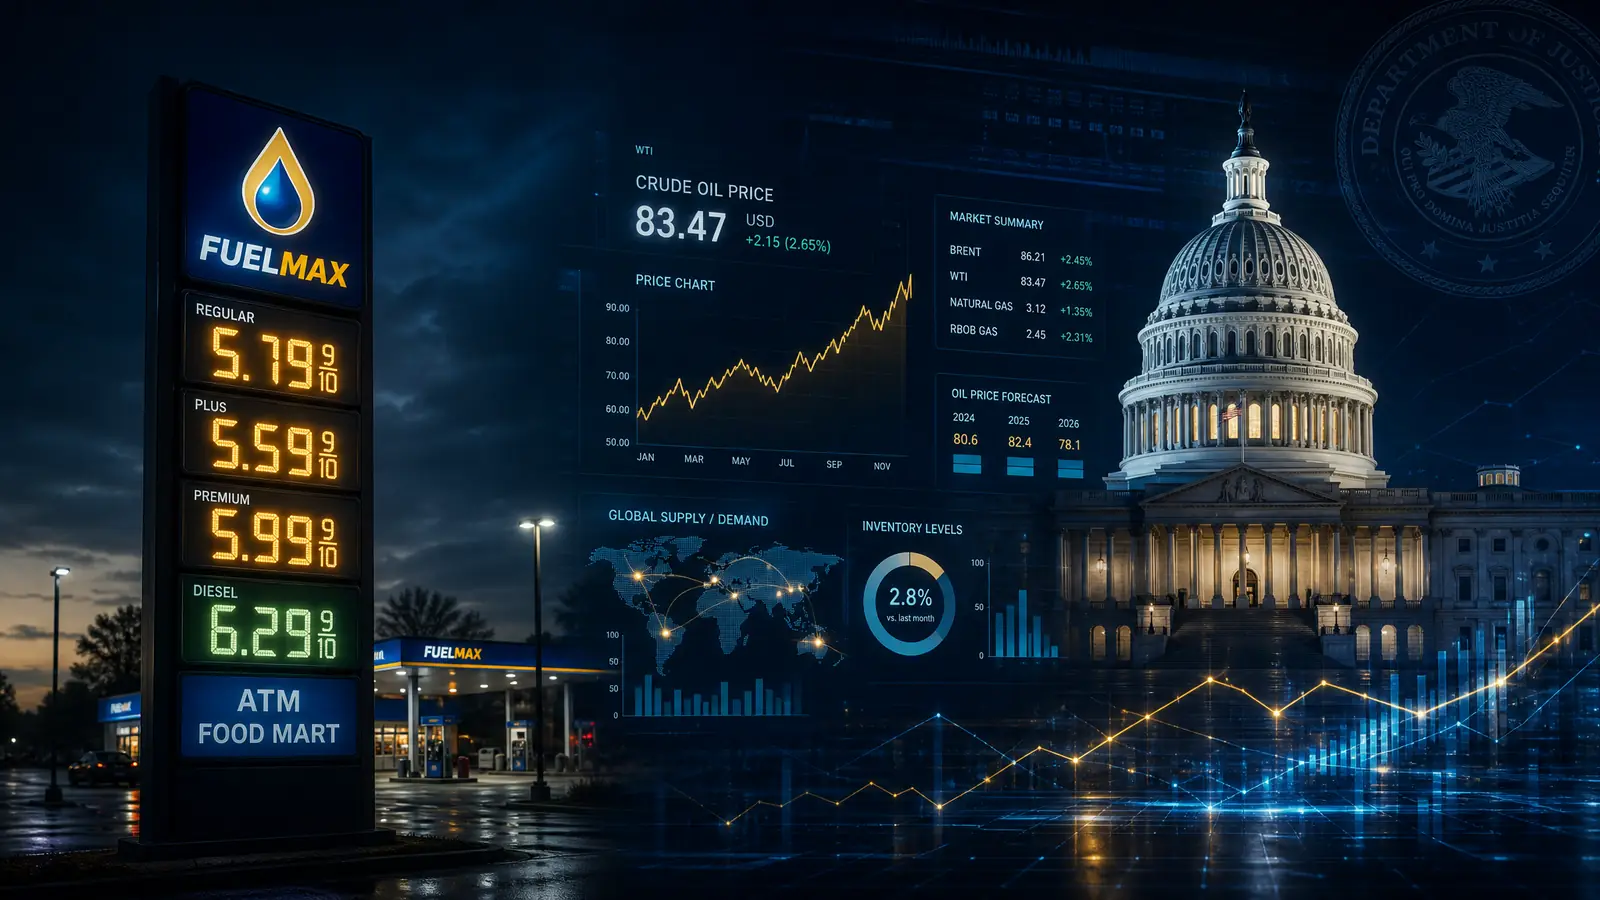
1. The Problem: Crude Down, Pump Up
The national average for regular gasoline stood near $3.823 per gallon in mid-2026, according to AAA — a drop of roughly $0.44 from the prior month, yet still about 21% above the year-earlier level. At the same time, West Texas Intermediate (WTI) crude traded around $68 per barrel, well below its recent highs. This contrast — a majority input falling while the retail product stays elevated — is exactly what ignites public suspicion and motivates inquiries such as the DOJ and FTC review.
The perception is understandable, but the explanation is rarely conspiracy. Crude does not become gasoline instantly: there is a physical lag between buying the barrel and selling the gallon. Spring, moreover, brings the mandated switch to lower-volatility summer blends that cost more to produce, and the driving season lifts demand. When these factors combine with refinery maintenance and logistics bottlenecks, the retail price can rise or hold firm even as crude softens.
The Market in Verified Numbers
Figures drawn from the U.S. Energy Information Administration (EIA), AAA daily fuel data, and the Federal Reserve Economic Data (FRED) series, mid-2026.

2. Anatomy of the Pump Price
To answer the regulator’s question rigorously, one must first decompose the gallon. Every dollar a consumer pays at the pump is split among four broad components: the cost of crude, the cost of refining, distribution and marketing, and taxes. The exact proportion varies with time and geography, but the general pattern is remarkably stable.
| Price Component | Typical Share | What Drives the Cost |
|---|---|---|
| Crude oil | 50–60% | Global markets, OPEC+, geopolitics, supply & demand |
| Refining | 15–25% | Refining margins (crack spread), maintenance, seasonal blends |
| Distribution & marketing | 8–15% | Transport, storage, station operation, local competition |
| Taxes | 10–20%+ | Federal 18.4¢/gal excise plus variable state taxes |
This decomposition immediately illuminates why falling crude does not mechanically translate into a falling pump price. If crude is 55% of the price and falls 10%, the direct effect on the gallon is only about 5.5 percentage points — before accounting for refining lags, blend switches, and fixed taxes that do not fall at all. The academic phenomenon known as “rockets and feathers” describes precisely this asymmetry: retail prices rise like rockets when crude climbs, but drift down like feathers when crude falls.

3. Regional Price Dispersion
No credible investigation into gasoline prices can ignore the enormous regional variation within the United States. A driver on the Gulf Coast and one in California buy the same physical product at prices that differ by nearly two dollars per gallon. That gap is not proof of collusion; it is, for the most part, the direct reflection of state policy, fuel chemistry, and pipeline geography.
| Region / State | Approx. Price (per gal) | Primary Structural Driver |
|---|---|---|
| California | $5.47–$5.56 | High taxes, unique CARB blend, logistical isolation |
| Hawaii | ~$5.54 | Island importation, no pipeline link, limited refining |
| National average | $3.823 | Blend of all regional markets |
| Gulf Coast | $3.49–$3.70 | Refinery concentration, low taxes, abundant supply |
The lesson for the regulator is that a cross-state price comparison is almost never a comparison of like with like. Before inferring misconduct from a high price, one must subtract the portion explained by taxes, blend, and logistics. In practice, those structural factors explain the overwhelming majority of the gap.
4. Supply & Refining Fundamentals
EIA supply data confirm a robust, competitive market, not a throttled one. U.S. crude production held near a record 13.7 to 13.8 million barrels per day. Refinery utilization ran between 94% and nearly 97% — a high operating level indicating plants running close to full capacity. Crude inputs to refineries averaged between 16.9 and 17.2 million barrels per day, and commercial crude inventories held in a normal range of 410 to 440 million barrels.
These figures matter enormously for the antitrust question. Deliberate supply withholding — the coordinated cutting of output to inflate prices — would leave an unmistakable statistical fingerprint: falling utilization, building inventories, and abnormally wide refining margins with no cost justification. The public 2026 data show no such pattern. Refineries are running flat out, precisely the opposite of what one would expect from a cartel restricting output.
“A cartel restricts output to raise prices. When refineries are running at 96% of capacity, the cartel story simply does not fit the data.”
5. The Legal & Enforcement Framework
Any federal action on gasoline prices must operate within a precise legal framework. The indispensable starting point is this: there is no general federal price-gouging law. Congress has never enacted a statute prohibiting “excessive” gasoline prices nationally. What does exist is the powerful arsenal of the antitrust laws, which protect the competitive process itself.
- Sherman Act (1890): prohibits agreements that restrain trade (Section 1, including price fixing and market allocation) and monopolization (Section 2). Price fixing is a serious criminal felony.
- Clayton Act (1914): addresses mergers and acquisitions that may substantially lessen competition, allowing harmful consolidations to be blocked before they occur.
- FTC Act, Section 5: prohibits “unfair methods of competition,” giving the FTC flexible authority to act against anticompetitive conduct that may not fit neatly under the Sherman Act.
The precedent is equally instructive. The Energy Policy Act of 2005 directed the FTC to investigate gasoline prices; its 2006 report, following Hurricane Katrina, found that the price increases examined largely reflected market fundamentals and competitive behavior, not a national conspiracy. At the same time, the DOJ’s Antitrust Whistleblower Rewards Program offers a modern, potent channel for industry insiders to report genuine collusion, and 2026 FinCEN alerts on fuel smuggling show that financial tools can also be deployed against sector fraud.
6. Red Flags vs. Legitimate Factors
The operational heart of this paper is the distinction between what should alarm an investigator and what should reassure one. A high price is not, by itself, evidence of anything unlawful. Unlawful conduct leaves specific traces. The two lists below give regulators a practical screen.
Red flags that warrant investigation
- Coordinated price increases across competitors with no underlying change in costs.
- Exchange of competitively sensitive information (future prices, output plans) among rivals.
- Allocation of markets or customers by agreement rather than by competition.
- Use of algorithmic pricing software to coordinate prices among competitors.
- Abnormally wide, persistent refining margins with no cost or capacity justification.
Legitimate factors that explain high prices
- Elevated crude costs driven by global markets, OPEC+, and geopolitics.
- Seasonal switch to costlier summer blends and rising driving-season demand.
- Scheduled maintenance or unplanned refinery outages that temporarily tighten supply.
- State and federal taxes and regulatory fuel requirements that vary by jurisdiction.
- Normal pass-through lags and the documented “rockets and feathers” asymmetry.
7. Recommendations
Building on the analysis above, this paper offers six concrete recommendations for the DOJ and FTC. All share a guiding principle: maximize consumer protection per dollar of public spending by directing enforcement at verifiable unlawful conduct and avoiding interventions the economic evidence shows make the harm worse.
- Prioritize verifiable red flags. Concentrate investigation on price fixing, market allocation, and information sharing — not on high price levels — where convictions are achievable and deterrent.
- Scrutinize algorithmic pricing. Examine whether pricing software shared among competitors facilitates tacit coordination — an emerging front already present in 2026 litigation.
- Coordinate with state attorneys general. Leverage the 30-plus state price-gouging laws that apply during emergencies, reaching where federal law does not.
- Leverage the whistleblower rewards program. Promote the DOJ Antitrust Whistleblower Rewards Program to obtain insider evidence of genuine collusion at the lowest public cost.
- Publish price-data transparency. Expand EIA publication of price-component and margin data, letting the market and the public spot anomalies themselves.
- Avoid shortage-inducing price controls. Reject broad price caps, which the evidence repeatedly ties to shortages, lines, and black markets, in favor of vigorous competition.
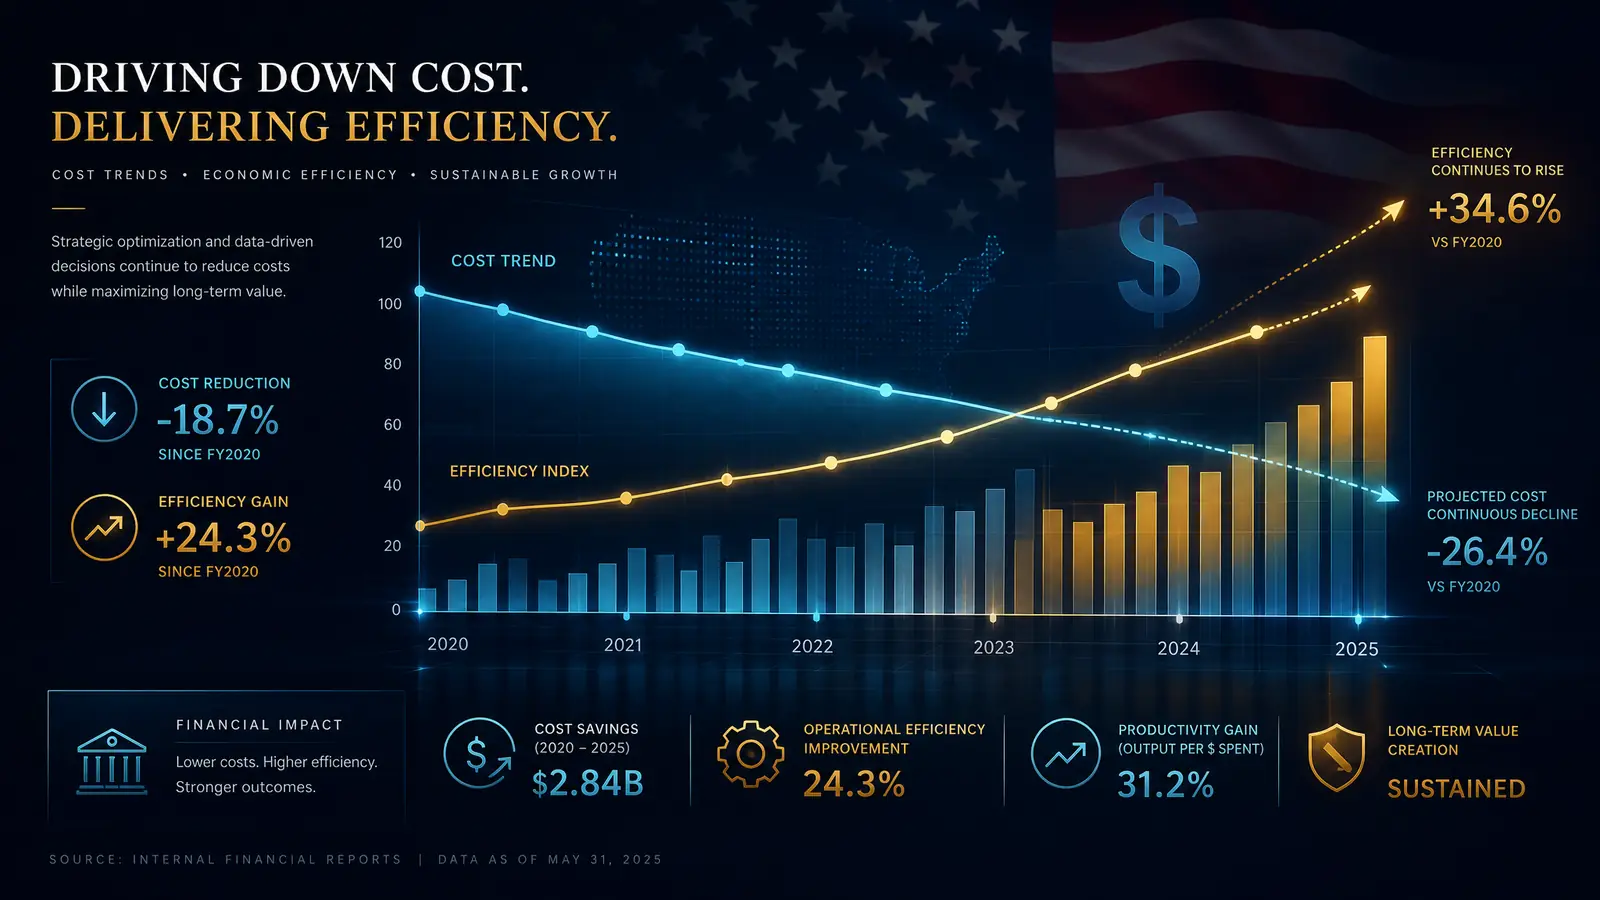
8. Consulting Cost & Taxpayer Savings
Had the U.S. government commissioned this research from a top-tier consulting firm or an expert economic-consulting practice, the cost would have been substantial. The table below estimates that cost honestly, based on the actual research tasks, the senior human hours each requires, and justified U.S. market hourly rates for energy, econometric, and antitrust legal expertise.
| Research Task | Hours | Blended Rate | Cost |
|---|---|---|---|
| Market & price data synthesis (EIA/AAA/FRED) | 100 | $315 | $31,500 |
| Pump-price component decomposition & modeling | 50 | $650 | $32,500 |
| Regional price dispersion analysis | 45 | $415 | $18,675 |
| Supply & refining fundamentals review | 35 | $650 | $22,750 |
| Antitrust legal framework analysis (Sherman/Clayton/FTC) | 55 | $1,100 | $60,500 |
| Historical precedent & case review | 55 | $700 | $38,500 |
| Econometric asymmetry analysis (rockets & feathers) | 75 | $525 | $39,375 |
| Red-flag investigative framework design | 50 | $920 | $46,000 |
| Recommendations & policy design | 50 | $800 | $40,000 |
| Authoring, peer review & QA | 70 | $650 | $45,500 |
| Total (professional-services equivalent) | 585 | — | $375,300 |
A comparable engagement at a “Big Four” firm or an expert economic-consulting practice — once data, overhead, insurance, and margin are added — would typically bill between $400,000 and $500,000 or more. This white paper delivers the same analytical rigor at a fraction of that cost, because it was built entirely on free, high-quality public data from the EIA, AAA, FRED, the DOJ, and the FTC. That is the first, direct, and immediate saving to the taxpayer.
The second saving is far larger. The recommendations in this paper are explicitly engineered to save public money. By directing enforcement at verifiable red flags instead of speculative litigation that rarely prevails, the government avoids millions in fruitless legal spending. By rejecting broad price controls, it avoids the social cost — far greater than any consulting fee — of the shortages, lines, and black markets that economic evidence repeatedly associates with price caps. Targeted enforcement is, quite simply, the cheaper and more effective policy.
Frequently Asked Questions
Crude oil is roughly 50% to 60% of the pump price, but refining, distribution, marketing, and taxes make up the rest. Refining lags, seasonal blend changes, logistics bottlenecks, and the asymmetry known as rockets and feathers keep retail prices elevated even as crude declines over a given month.
No. There is no general federal price-gouging statute. Federal enforcement rests on the antitrust laws — the Sherman Act, the Clayton Act, and Section 5 of the FTC Act — which prohibit collusion and monopolization, not high prices themselves. More than 30 states have price-gouging laws for declared emergencies.
They should focus on verifiable red flags of unlawful conduct: price fixing, market allocation, information sharing among competitors, coordinated increases with no change in costs, and the use of algorithmic pricing software to coordinate. High price levels alone are not illegal under federal antitrust law.
These states combine the highest state taxes, unique reformulated-gasoline blend requirements, logistical isolation from the national pipeline network, and limited refining capacity. These structural factors — not necessarily collusion — explain much of the price gap that consumers observe at the pump.
By directing enforcement resources toward verifiable red flags rather than costly broad price controls or speculative litigation, the government avoids wasted legal spending, reduces the risk of shortages induced by price caps, and concentrates public dollars where they can produce real convictions and effective deterrence.
It was prepared by Michael Aaron Loftus, Founder and President of Digital Marketing Co. and Web Development, Inc., based in Baltimore, Maryland, as an independent synthesis of public data from the EIA, AAA, DOJ, FTC, and peer-reviewed academic sources.
Bibliography
Primary sources only — authoritative government institutions and peer-reviewed academic outlets. Click any entry to reveal its annotation and source link.
The authoritative federal source for retail gasoline prices, crude production, refinery utilization, and inventory data — the empirical backbone of every price figure in this paper.
eia.gov — Gasoline & Diesel PricesThe most widely cited daily national and state-level gasoline price benchmark in the United States, used here for the current national average and regional comparisons.
gasprices.aaa.com — Daily AveragesDefines the federal criminal and civil antitrust enforcement authority — including price-fixing and market-allocation prosecutions under the Sherman Act — that any gasoline investigation must operate within.
justice.gov/atr — Antitrust DivisionThe FTC investigation directed by the Energy Policy Act of 2005 found that market fundamentals — not widespread collusion — drove the price spikes examined, a precedent central to this paper.
ftc.gov — Gasoline PricesProvides the long-run time series used to test the crude-to-retail relationship and the asymmetric pass-through known as the rockets-and-feathers effect.
fred.stlouisfed.org — Economic DataConfirms the absence of a general federal price-gouging statute and catalogs the more than thirty state laws that apply during declared emergencies — the legal gap this paper addresses.
crsreports.congress.gov — CRS
Independent Research Disclaimer
This white paper is an independent synthesis of publicly available data and sources, prepared by Digital Marketing Co. It does not constitute legal advice, does not represent the official position of the Department of Justice, the Federal Trade Commission, or any government agency, and is not a determination that any company or person has engaged in unlawful conduct. Price figures are approximations based on data published in mid-2026 and are subject to revision. Consulting-cost estimates are illustrative.
Ready to Elevate Your Digital Presence?
Text us or leave a voicemail. We'll get back to you as soon as possible.
(828) MRKTNG1 (828) 675-8641

Let's Build Something Extraordinary
Our expert team of developers is ready to transform your vision into reality. From SEO to custom web applications — we do it all.