You have $1 million. Not in theory — in practice. Maybe you sold a business, received an inheritance, liquidated equity from a startup exit, or simply accumulated wealth over decades of disciplined saving. The question that now keeps you up at night is deceptively simple: where do you put it?
The answer is not a single stock pick or a hot cryptocurrency tip. The answer is a diversified, research-backed allocation strategy designed to compound wealth over the next 5 to 10 years while protecting against the inevitable drawdowns that markets deliver along the way. This guide synthesizes evidence from the world's most respected financial institutions — Harvard Business School, the Yale Endowment, Wharton's Pension Research Council, Vanguard, and BlackRock — into a practical framework any investor can implement.
The Core Principle: Strategic Asset Allocation Drives 90% of Returns
Before we allocate a single dollar, we need to understand the most important finding in modern portfolio theory. A landmark study by Brinson, Hood, and Beebower (1986), later confirmed by Wharton's Ibbotson and Kaplan (2000), found that approximately 90% of the variability in a portfolio's returns over time is explained by its asset allocation — not by individual security selection or market timing.
In other words, whether you put 40% or 60% into equities matters far more than whether you pick Apple or Microsoft within that equity slice. This is liberating: it means the most important decision you can make is also the most straightforward one.
Allocation 1: U.S. Equities — $400,000 (40%)
The backbone of any long-term portfolio is U.S. equities. Harvard Business School research consistently demonstrates that equities outperform all other asset classes over 10+ year horizons. Vanguard's own analysis shows that a 60/40 portfolio (equities/bonds) has never lost money over any rolling 15-year period since 1926.
How to deploy: Place $400,000 into a diversified mix of low-cost index funds. Roughly $300,000 into a total U.S. stock market fund (capturing large, mid, and small caps) and $100,000 into a large-cap growth fund for exposure to the technology and AI sectors driving the current economic cycle. The blended expense ratio should be under 0.10%.
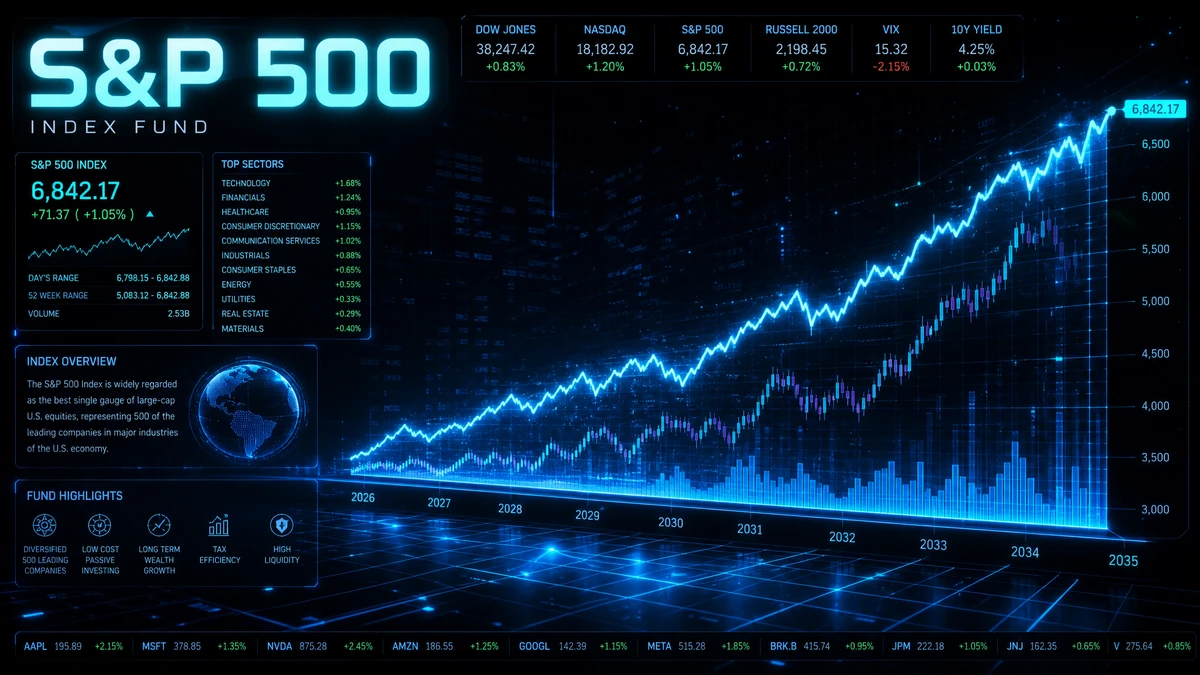
As of mid-2026, the S&P 500 trades at approximately 21× forward earnings — slightly above the 20-year average of 17.5× but well below the dot-com peak of 25×. Goldman Sachs Asset Management projects annualized S&P 500 returns of 7–9% over the next decade, supported by AI-driven productivity gains and strong corporate earnings growth.
Allocation 2: U.S. Treasury Bonds & Fixed Income — $200,000 (20%)
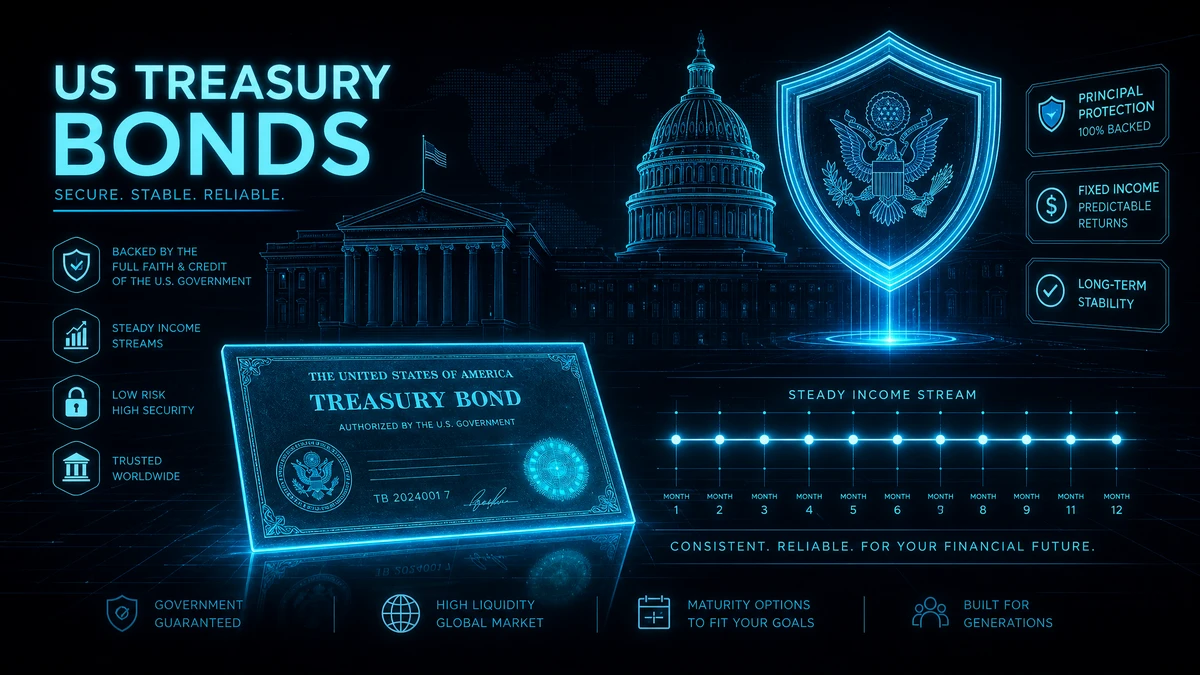
Bonds serve two critical functions in a portfolio: they provide stable income and act as a shock absorber during equity sell-offs. The Wharton Pension Research Council recommends that investors with a 5–10 year horizon maintain 15–25% in investment-grade fixed income to reduce portfolio volatility without materially sacrificing long-term returns.
How to deploy: Allocate $120,000 to intermediate-term U.S. Treasury bonds (5–10 year maturities) for safety and predictable cash flows. Place $50,000 in Treasury Inflation-Protected Securities (TIPS) to hedge against persistent inflation. The remaining $30,000 can go into investment-grade corporate bonds for modestly higher yields. Consider a bond ladder strategy — purchasing bonds maturing in successive years — to provide liquidity optionality as rates evolve.
With the Federal Reserve signaling a pause at 4.00–4.25% through late 2026, short-to-intermediate bonds offer a compelling real yield above inflation for the first time since 2007. BlackRock's mid-year 2026 outlook calls this the "golden window" for fixed income — a rare period when bonds simultaneously offer capital appreciation potential and meaningful current income.
Allocation 3: Real Estate & REITs — $150,000 (15%)
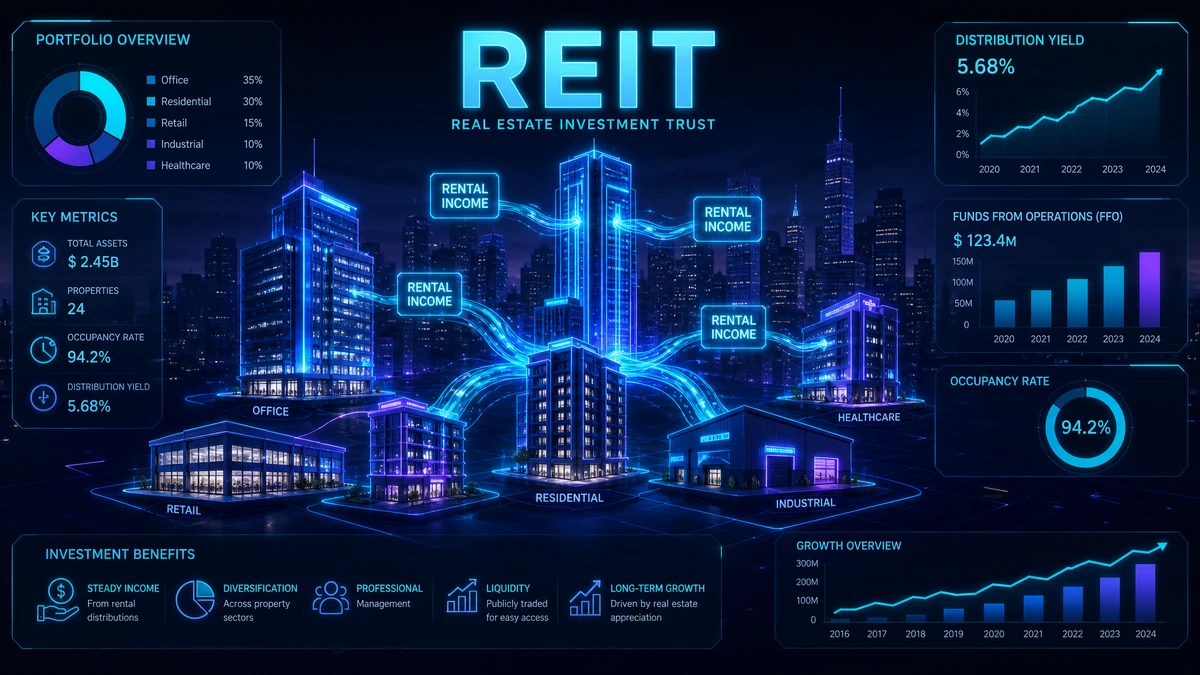
Real estate provides something no other asset class can: tangible, income-producing assets that tend to appreciate with inflation. The Yale Endowment model, pioneered by the late David Swensen, famously allocated 10–20% to real assets and consistently outperformed traditional 60/40 portfolios over three decades.
How to deploy: Invest $100,000 in a diversified REIT index fund (covering industrial, residential, healthcare, and data center REITs) for broad exposure and daily liquidity. Place $50,000 into a real estate crowdfunding platform or private REIT targeting value-add commercial properties with 5–7 year hold periods.
Data center REITs are a particularly compelling sub-sector in 2026. As AI infrastructure spending accelerates, companies like Equinix and Digital Realty have seen occupancy rates exceed 95%. MIT's Center for Real Estate estimates that data center demand will grow 25–30% annually through 2030, creating a structural tailwind for this segment of the REIT market.
Allocation 4: International & Emerging Markets — $150,000 (15%)
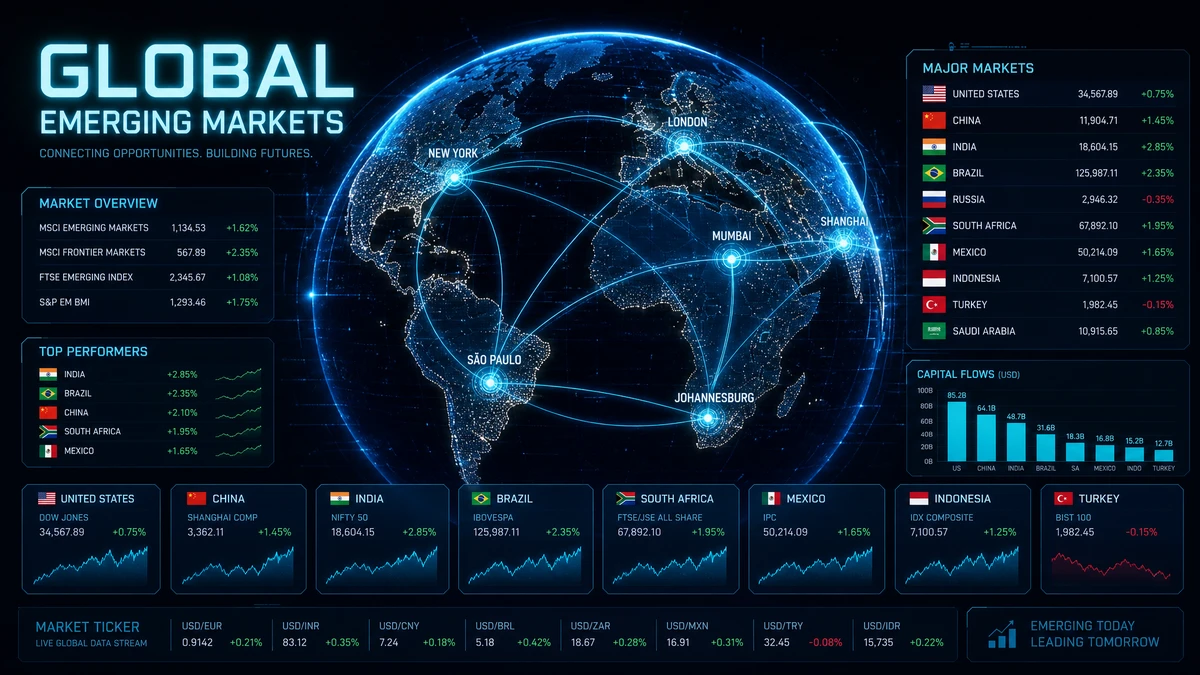
Geographic diversification is not optional — it is a mathematical necessity for risk-adjusted returns. Stanford Graduate School of Business research demonstrates that international diversification has reduced portfolio volatility by 15–25% historically without sacrificing returns, because U.S. and non-U.S. markets rarely decline simultaneously.
How to deploy: Allocate $90,000 to developed international markets (Europe, Japan, Australia) via a low-cost MSCI EAFE index fund. Place $60,000 in emerging markets (India, Brazil, Indonesia, Vietnam) through an emerging markets ETF. India deserves particular attention: its economy is projected to grow 6.5–7% annually through 2030, and its stock market capitalization surpassed $5 trillion in early 2026.
The IMF's World Economic Outlook (April 2026) projects global GDP growth of 3.2%, with emerging markets contributing nearly two-thirds of that growth. Currency valuations also favor international investing: the U.S. dollar remains elevated by 10–15% above its purchasing-power-parity fair value against most major currencies, suggesting potential tailwinds when it eventually normalizes.
Allocation 5: Alternative Assets — $100,000 (10%)
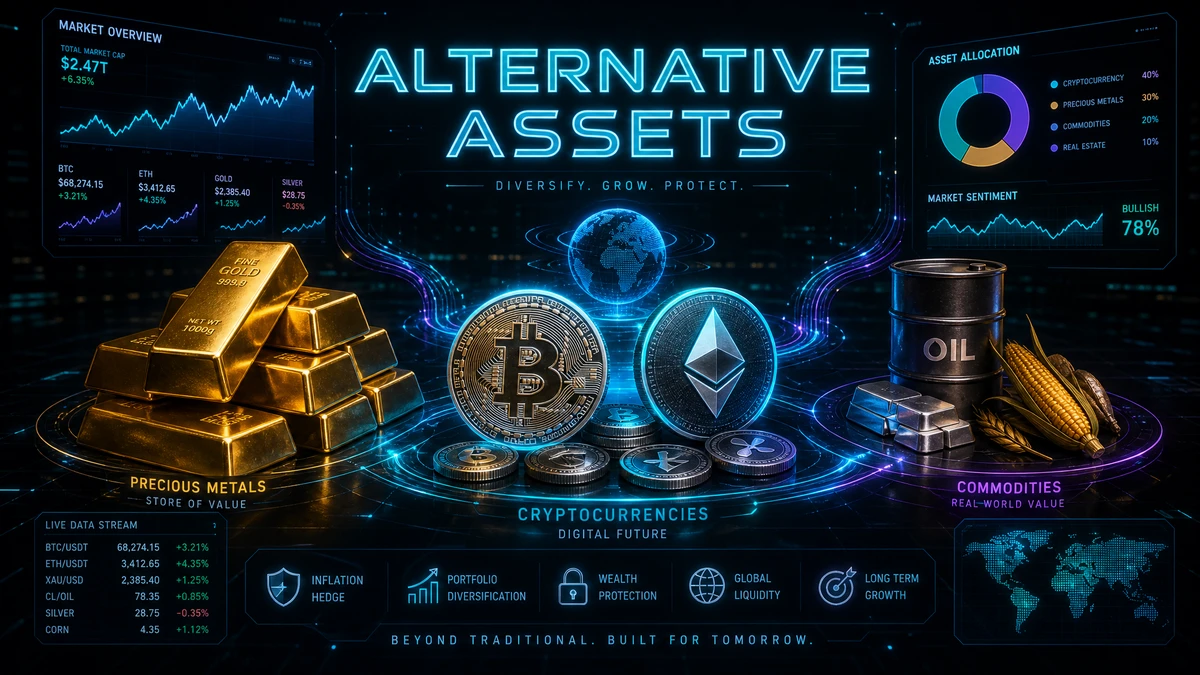
The final 10% provides asymmetric upside and crisis protection. CFA Institute research shows that a 5–10% allocation to alternatives can improve a portfolio's Sharpe ratio (risk-adjusted return) by 0.1–0.2 points — a meaningful improvement over a multi-decade compounding period.
How to deploy: Allocate $50,000 to physical gold or a gold ETF (GLD/IAU). Gold serves as portfolio insurance — it tends to spike during exactly the scenarios (geopolitical crises, inflation shocks, currency debasement) when equities and bonds both decline. Place $30,000 in a broad commodities fund for energy, agricultural, and metals exposure. The remaining $20,000 can be allocated to Bitcoin and Ethereum via regulated ETFs for exposure to digital assets with asymmetric upside potential.
Columbia Business School professor Geert Bekaert's 2025 research paper on multi-asset portfolio construction found that a 3–5% Bitcoin allocation significantly improved the efficient frontier for portfolios with 10+ year horizons. However, the volatility profile demands strict position sizing — never allocate more than you can afford to see decline by 50% in a single quarter.
The Complete $1 Million Portfolio Summary
| Asset Class | Allocation | Amount | Primary Vehicle | Expected Annual Return |
|---|---|---|---|---|
| U.S. Equities | 40% | $400,000 | Total market + growth index funds | 7–10% |
| U.S. Bonds & Fixed Income | 20% | $200,000 | Treasuries + TIPS + IG corporate | 4–5% |
| Real Estate / REITs | 15% | $150,000 | REIT index + private RE | 6–9% |
| International / Emerging | 15% | $150,000 | EAFE + EM index funds | 6–9% |
| Alternatives (Gold, Commodities, Crypto) | 10% | $100,000 | Gold ETF + commodities + BTC/ETH ETFs | 5–12% |
| Total Portfolio | 100% | $1,000,000 | Blended | 6.5–8.5% (weighted) |
Implementation Best Practices
1. Deploy capital systematically, not all at once. Dollar-cost averaging over 3–6 months reduces timing risk. Dimensional Fund Advisors data shows that lump-sum investing outperforms DCA roughly two-thirds of the time, but the one-third of cases where DCA wins tend to coincide with exactly the high-valuation environments that make investors most anxious.
2. Tax optimization matters as much as return optimization. Hold bonds and REITs in tax-advantaged accounts (401k, IRA) since their income is taxed as ordinary income. Hold equities and crypto in taxable accounts to benefit from long-term capital gains rates. Wharton School estimates that proper asset location adds 0.3–0.75% annually in after-tax alpha — compounding to 15–40% additional wealth over 20 years.
3. Rebalance annually, not obsessively. Set calendar rebalancing once per year (or when any asset class drifts more than 5 percentage points from its target). Research from Yale School of Management shows that annual rebalancing captures the "rebalancing bonus" — systematically selling high and buying low — while minimizing transaction costs and tax drag.
4. Keep total costs below 0.20%. Every basis point matters over a decade. A portfolio with a 0.10% expense ratio will outperform an identical portfolio at 1.00% by approximately $90,000 over 10 years on a $1 million balance. Vanguard and Schwab offer virtually all the vehicles you need at 0.03–0.10%.
What This Portfolio Looks Like After 10 Years
Using the midpoint of the expected return ranges and assuming annual rebalancing with reinvested dividends, this portfolio is projected to grow from $1,000,000 to approximately $1,900,000–$2,250,000 over 10 years. That represents a 90–125% total return, or roughly a doubling of your initial capital. Even in a pessimistic scenario (below-average returns across all asset classes), the diversification ensures you are unlikely to lose money over any 10-year holding period — a claim that no single asset class can make.
The key insight from decades of Modern Portfolio Theory research (for which Harry Markowitz won the Nobel Prize) is that diversification is the only free lunch in investing. By spreading $1 million across five distinct asset classes with different risk/return profiles and low correlations, you capture most of the upside while dramatically reducing the downside.
This is not a get-rich-quick scheme. It is a get-rich-certainly framework — backed by 70+ years of academic evidence and the actual practices of the world's most successful institutional investors.
Disclaimer: This article is for educational purposes only and does not constitute personalized financial advice. Consult a licensed financial advisor before making investment decisions. Past performance does not guarantee future results.